Main Page
Frequently Asked Questions
Disclaimers
Contact
Benefactors
How to improve this website
The ECG course
Introduction
Basics
Rhythm
Rate
Conduction (PQ,QRS,QT)
Heart axis
P wave morphology
QRS morphology
ST morphology
The ECG textbook
Normal tracing
Technical Problems
Sinus rhythms
Arrhythmias:
- supraventricular
- junctional
- ventricular
- genetic
- ectopic beats
AV Conduction
Intraventricular Conduction
Myocardial Infarction
QRS axis and voltage
Chamber Hypertrophy
Repolarization
Clinical Disorders
Electrolyte Disorders
Pacemaker
Cases and Examples
Cases and Examples
Guess the Culprit
Rhythm Puzzles
Tools
What links here
Related changes
Special pages
Printable version
Permanent link
Page information This page was last edited on 3 March 200
===========================
Introduction
Jump to navigation Jump to search
«/ Basics»
Author(s) J.S.S.G. de Jong, MD
Moderator J.S.S.G. de Jong, MD
Supervisor
some notes about authorship
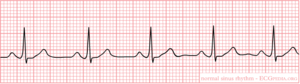
A short ECG registration of normal heart rhythm (sinus rhythm)
The aim of this course is to enable the student to understand and recognize normal ECGs and interpret abnormalities. The course is divided into two different sections. First the basics will be presented. This is followed by the interpretation of the normal ECG according to the 7+2 step plan:
7+2 step plan
Step 1: Rhythm
Step 2: Rate
Step 3: Conduction (PQ,QRS,QT)
Step 4: Heart axis
Step 5: P wave morphology
Step 6: QRS morphology
Step 7: ST morphology
Step 7+1: Compare the current ECG with a previous one
Step 7+2: Conclusion
Note: It is important to realize that not all these steps may be applicable when you encounter ECG abnormalities. If, for example, the rhythm is not sinus in the first step, the algorithm to analyze arrhythmias should be followed. If a Left Bundle Branch Block is present in step 3, ST morphology will be strongly influenced by this defect.
Finally the real world is presented through practice ECGs.
After you have finished the course you are invited to come back to read more about abnormal ECGs in the ECG textbook.
ECG textbook
Normal Tracing
A Concise History of the ECG
Technical Problems
Sinus Rhythms Sinus Tachycardia
Sinus Bradycardia
Arrhythmias: Supraventricular
Junctional
Ventricular
Genetic
Ectopic Beats
AV Conduction
Intraventricular Conduction
Myocardial Infarction
Chamber Hypertrophy
Repolarization
Clinical Disorders
Electrolyte Disorders
Pacemaker
ECGs in Athletes
ECGs in Children
Accuracy of Computer Interpretation Also read our Frequently Asked Questions section.
=====
Basics
Jump to navigation Jump to search
«Introduction Step 1: Rhythm»
Author(s) I.A.C. van der Bilt, MD
Moderator I.A.C. van der Bilt, MD
Supervisor
some notes about authorship
Contents 1 How do I begin to read an ECG?
2 What does the ECG register?
3 The ECG represents the sum of the action potentials of millions of cardiomyocytes
4 The electric discharge of the heart
5 The different ECG waves
6 The history of the ECG
7 The ECG electrodes 7.1 The Extremity Leads
7.2 The Chest Leads
8 ECG variants
9 Color coding of the ECG leads
10 Special Leads
11 Ladder diagram
12 Technical Problems
13 References
How do I begin to read an ECG?
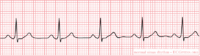
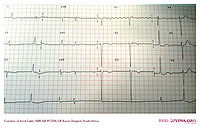
A short ECG registration of normal heart rhythm (sinus rhythm)
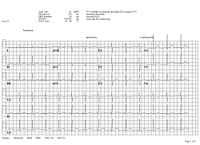
An example of a normal ECG. Click on the Image for an enlargement
Click on the ECG to see an enlargement. Where do you start when interpreting an ECG? On the top left are the patient's information, name, sex and date of birth
At the right of that are below each other the Frequency, the conduction times (PQ,QRS,QT/QTc), and the heart axis (P-top axis, QRS axis and T-top axis)
Farther to the right is the interpretation of the ECG written (this may be missing in a 'fresh' ECG, but later the interpretation of the cardiologist or computer will be added)
Down left is the 'paper speed' (25 mm/s on the horizontal axis), the sensitivity (10mm/mV) and the filter's frequency (40Hz, filters noise from eg. lights).
There is a calibration. At the beginning of every lead is a vertical block that shows with what amplitude a 1 mV signal is drawn. So the height and depth of these signals are a measurement for the voltage. If this is not set at 10 mm, there is something wrong with the machine setting.
Finally we have the ECG leads themselves.These will be discussed below.
Note that the layout is different for each machine, but most machines will show the information above somewhere.
What does the ECG register? The electrocardiogramAn electrocardiogram (ECG or EKG) is a register of the heart's electrical activity.
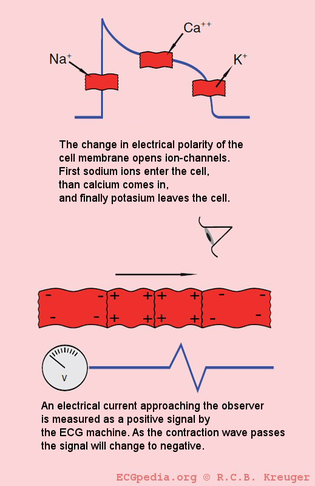
Just like skeletal muscles, heart muscles are electrically stimulated to contract. This stimulation is also called activation or excitation. Cardiac muscles are electrically charged at rest. The inside of the cell is negatively charged relative to the outside (resting potential). If the cardiac muscle cells are electrically stimulated, they depolarize (the resting potential changes from negative to positive) and contract. The electrical activity of a single cell can be registered as the action potential. As the electrical impulse spreads through the heart, the electrical field changes continually in size and direction. The ECG is a graph of these electrical cardiac signals.
The ECG represents the sum of the action potentials of millions of cardiomyocytes
Ion currents of the cardiomyocytes
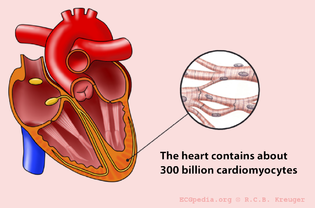
The heart consists of approximately 300 billion cells
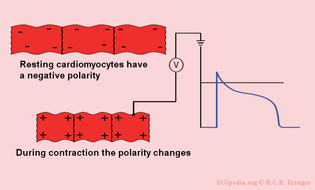
In rest the heart cells are negatively charged. Through the depolarization by surrounding cells they become positively charged and they contract.
<youtube>j9w1qylp4TY</youtube>
This movie shows the contraction of a single (rabbit) heart cell. The glass electrode measures the electrical current in the heart cell (with thepatch-clamp method). The electrical signal is written in blue and shows the action potential. Courtesy of Arie Verkerk and Antoni van Ginneken, AMC, Amsterdam, The Netherlands.
The individual action potentials of the individual cardiomyocytes are averaged. The final result, which is shown on the ECG, is actually the average of billions of microscopic electrical signals.
During the depolarization, sodium ions stream into the cell. Subsequently, the calcium ions stream into the cell. These calcium ions cause the actual muscular contraction.
Finally the potassium ions stream out of the cell. During repolarization the ion concentration returns to its precontraction state. On the ECG, an action potential wave coming toward the electrode is shown as a positive (upwards) signal. Here the ECG electrode is represented as an eye.
The electric discharge of the heart
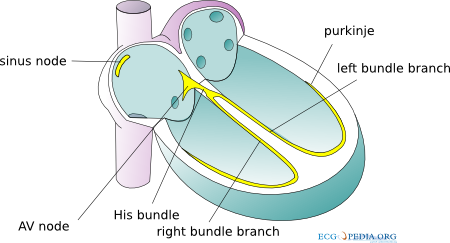
The conduction system of the heart
The sinoatrial node (SA node) contains the fastest physiological pacemaker cells of the heart; therefore, they determine the heart rate. First the atria depolarize and contract. After that the ventricles depolarize and contract. The electrical signal between the atria and the ventricles goes from the sinus node via the atria to the AV-node (atrioventricular transition) to the His bundle and subsequently to the right and left bundle branches, which end in a dense network of Purkinje fibers. The depolarization of the heart results in an electrical force which has a direction and magnitude; an electrical vector. This vector changes every millisecond of the depolarization. In the animation vectors for atrial depolarization, ventricular depolarization and ventricular repolarization are shown.
The different ECG waves
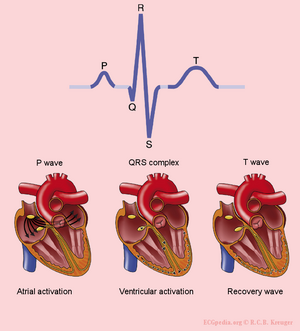
The origin of the different waves on the ECG
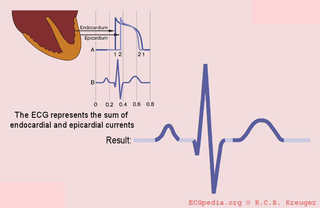
The QRS complex is formed by the sum of the electric avtivity of the inner (endocardial) and the outer (epicardial) cardiomyocytes
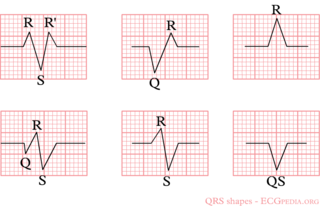
Example of the different QRS configurations
The P wave is the result of the atrial depolarization. This depolarization starts in the SA (sinoatrial) node. The signal produced by pacemaker cells in the SA node is conducted to the right and left atria. Normal atrial repolarization is not visible on the ECG (but can be visible during atrial infarction and pericarditis).
The QRS complex is the average of the depolarization waves of the inner (endocardial) and outer (epicardial) cardiomyocytes. As the endocardial cardiomyocytes depolarize slightly earlier than the outer layers, a typical QRS pattern occurs (figure).
The T wave represents the repolarization of the ventricles. There is no cardiac muscle activity during the T wave.
One heart beat consists of an atrial depolarization --> atrial contraction --> p-wave, ventricular depolarization --> ventricular contraction --> ORS-complex and the resting phase (including the repolarization during the T-wave) between two heart beats.
Have a look at this [animation of the heart cycle]
The origin of the U wave is unknown. This wave possibly results from "afterdepolarizations" of the ventricles.
The letters "Q", "R" and "S" are used to describe the QRS complex
Q: the first negative deflection after the p-wave. If the first deflection is not negative, the Q is absent.
R: the positive deflection
S: the negative deflection after the R-wave
Small print letters (q, r, s) are used to describe deflections of small amplitude. For example: qRS = small q, tall R, deep S.
R`: is used to describe a second R-wave (as in a right bundle branch block)
See figure for some examples of this.
The history of the ECG
A concise history of the ECG is presented in a different chapter.
The ECG electrodes
The limb leads
The chest leads
Electrical activity going through the heart can be measured by external (skin)electrodes. The electrocardiogram (ECG) registers these activities from electrodes which have been attached onto different places on the body. In total, twelve leads are calculated using ten electrodes.
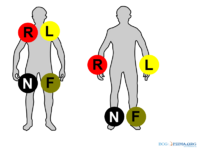
The ten electrodes are: The four extremity electrodes: LA - left arm
RA - right arm
N - neutral, on the right leg (= electrical earth, or point zero, to which the electrical current is measured)
F - foot, on the left leg
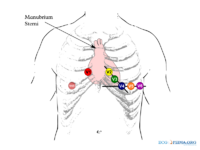
It makes no difference whether the electrodes are attached proximal or distal on the extremities. However, it is best to be uniform in this. (eg. do not attach an electrode on the left shoulder and one on the right wrist). The six chest electrodes: V1 - placed in the 4th intercostal space, right of the sternum
V2 - placed in the 4th intercostal space, left of the sternum
V3 - placed between V2 and V4
V4 - placed 5th intercostal space in the nipple line. Official recommendations are to place V4 under the breast in women.[1]
V5 - placed between V4 and V6
V6 - placed in the midaxillary line on the same height as V4 (horizontal line from V4, so not necessarily in the 5th intercostal space)
With the use of these 10 electrodes, 12 leads can be derived. There are 6 extremity leads and 6 precordial leads.
The Extremity Leads
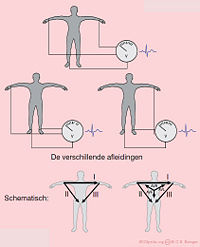
The extremity leads are: I from the right to the left arm
II from the right arm to the left leg
III from the left arm to the left leg
An easy rule to remember: lead I + lead III = lead II This is done with the use of the height or depth, independent of the wave (QRS, P of T). Example: if in lead I, the QrS complex is 3 mm in height and in lead III 9mm, the height of the QRS-complex in lead II is 12mm.
Other extremity leads are: AVL points to the left arm
AVR points to the right arm
AVF points to the feet
The capital A stands for "augmented" and V for "voltage".
(aVR + aVL + aVF = 0)
The Chest Leads
The precordial, or chest leads, (V1,V2,V3,V4,V5 and V6) 'observe' the depolarization wave in the frontal plane.
Example: V1 is close to the right ventricle and the right atrium. Signals in these areas of the heart have the largest signal in this lead. V6 is the closest to the lateral wall of the left ventricle.
ECG variants
Besides the standard 12 lead ECG a couple of variants are in use: The 3 channel ECG uses 3 or 4 ECG electrodes. Red is on the right, yellow on the left arm, green on the left leg ('sun shines on the grass') and black on the right leg. These basic leads yield enough information for rhythm-monitoring. For determination of ST elevation, these basic leads are inadequate as there is no lead that gives (ST) information about the anterior wall. ST changes registered during 3-4 channel ECG monitoring should prompt acquisition of a 12 lead ECG.
The 5 channel ECG uses 4 extremitiy leads and 1 precordial lead. This improves ST segment accuracy, but is still inferior to a 12 lead ECG. [2][3]
In vector electrocardiography the movement of electrical acitivity of the P, QRS and T wave is described. Additional X,Y and Z leads are recorded. Vector electrocardiography is rarely used nowadays, but is sometimes useful in a research setting.
In body surface mapping several arrays are used to accurately map the cardiac electrical wavefront as it moves over de body surface. With this information the electrical acitivity of the heart can be calculated. This is sometimes used in a research setting.
Color coding of the ECG leads
Two systems for ECG lead color coding are used: the AHA (American Heart Association) system and the IEC (International Electrotechnical Commission) system:
AHA (American Heart Association) IEC (International Electrotechnical Commission)
Location Inscription Colour Inscription Colour
Right Arm RA White R Red
Left Arm LA Black L Yellow
Right Leg RL Green N Black
Left Leg LL Red F Green
Chest V1 Brown/Red C1 White/Red
Chest V2 Brown/Yellow C2 White/Yellow
Chest V3 Brown/Green C3 White/Green
Chest V4 Brown/Blue C4 White/Brown
Chest V5 Brown/Orange C5 White/Black
Chest V6 Brown/Purple C6 White/Violet
Special Leads
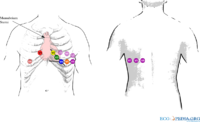
Leads V7,V8 and V9 can be helpful in the diagnosis of posterior myocardial infarction
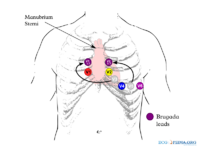
Changed lead positions of leads V3 and V5 to increase the sensitiviy to 'catch' a Brugada pattern on the ECG.
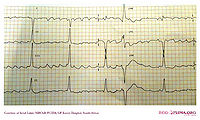
A patient with atrial fibrillation with a 'Lewis Lead' positioning of the leads. Compared with the normal lead configuration, the atrial signal is enlarged. Although some parts have a 'sawtooth' appearance consistent with atrial flutter, the rhythm is atrial fibrillation as there is a changing pattern in the atrial activity.
The same patient with a normal lead configuration. The rhythm is atrial fibrillation. The atrial activity in lead V1 is organized probably due to a organisation of electrical activity after it enters the right atrial appendage, close to lead V1.
Throughout history extra lead positions have been tried. Most are rarely used in practice, but they can deliver very valuable diagnostic clues in specific cases. Leads to improve diagnosis in right ventricular en posterior infarction:
In case of an inferior wall infarct, extra leads may be used: 1. On a right-sided ECG, V1 and V2 remain on the same place. V3 to V6 are placed on the same place but mirrored on the chest. So V4 is in the middle of the right clavicle. The ECG should be marked as a Right-sided ECG. V4R (V4 but right sided) is a sensitive lead for diagnosing right ventricular infarctions. 2. Leads V7-V8-V9 can be used to diagnose a posterior infarct. After V6, leads are placed towards the back. See the chapter Ischemia for other ways of diagnosing posterior infarction.
Leads to improve detection of atrial rhythm: In wide complex tachycardia, good detection of atrial rhythm and atrio-ventricular dissociation can be very helpful in the diagnosis process. An esophagal ECG electrode placed close to the atria can be helpful. Another, less invasive, method is the Lewis Lead. This is recorded by changing the limb electrodes, placing the right arm electrode in the second intercostal space and the left arm electrode in the fourth intercostal space, both to the right of the sternum. Furthermore gain is increased to 20mm/mV and paper speed to 50mm/sec.[4]ß Lead positioning to enhance detection of Brugada syndrome
Ladder diagram
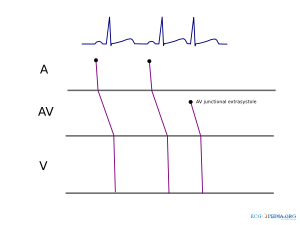
A ladder diagram is a diagram that shows the presumed origin of impulse formation and conduction in the heart. A = atrial, AV = AV node, V = ventricles
A ladder diagram is a diagram to explain arrhythmias. The figure shows a simple ladder diagram for normal sinus rhythm, followed by av-nodal extrasystole. The origin of impulse formation (sinus node for the first two beats and AV junction for the third beat) and the conduction in the heart are shown.
Technical Problems
Also read the chapter about Technical Problems. That will help you recognize electrical disturbances and lead reversals.
References Kligfield P, Gettes LS, Bailey JJ, Childers R, Deal BJ, Hancock EW, van Herpen G, Kors JA, Macfarlane P, Mirvis DM, Pahlm O, Rautaharju P, Wagner GS, American Heart Association Electrocardiography and Arrhythmias Committee, Council on Clinical Cardiology, American College of Cardiology Foundation, Heart Rhythm Society, Josephson M, Mason JW, Okin P, Surawicz B, and Wellens H. Recommendations for the standardization and interpretation of the electrocardiogram: part I: The electrocardiogram and its technology: a scientific statement from the American Heart Association Electrocardiography and Arrhythmias Committee, Council on Clinical Cardiology; the American College of Cardiology Foundation; and the Heart Rhythm Society: endorsed by the International Society for Computerized Electrocardiology. Circulation. 2007 Mar 13;115(10):1306-24. DOI:10.1161/CIRCULATIONAHA.106.180200 | PubMed ID:17322457 | HubMed [Kligfield]
Rodrigues de Holanda-Miranda W, Furtado FM, Luciano PM, and Pazin-Filho A. Lewis lead enhances atrial activity detection in wide QRS tachycardia. J Emerg Med. 2012 Aug;43(2):e97-9. DOI:10.1016/j.jemermed.2009.08.057 | PubMed ID:20022196 | HubMed [Lewis1]
Du Bois-Reymond, E. Untersuchungen über thierische Elektricität. Reimer, Berlin: 1848. [Dubois]
Hoffa M, Ludwig C. 1850. Einige neue versuche uber herzbewegung. Zeitschrift Rationelle Medizin, 9: 107-144 [Hoffa]
Waller AD. A demonstration on man of electromotive changes accompanying the heart's beat. J Physiol (London) 1887;8:229-234 [Waller]
Einthoven W. Le telecardiogramme. Arch Int de Physiol 1906;4:132-164 [Einthoven]
Einthoven W. Über die Form des menschlichen Electrocardiogramms. Pfügers Archiv maart 1895, pagina 101-123 [Einthoven2]
Marey EJ. Des variations electriques des muscles et du couer en particulier etudies au moyen de l'electrometre de M Lippman. Compres Rendus Hebdomadaires des Seances de l'Acadamie des sciences 1876;82:975-977 [Marey]
Márquez MF, Colín L, Guevara M, Iturralde P, and Hermosillo AG. Common electrocardiographic artifacts mimicking arrhythmias in ambulatory monitoring. Am Heart J. 2002 Aug;144(2):187-97. DOI:10.1067/mhj.2002.124047 | PubMed ID:12177632 | HubMed [Marquez]
Hurst JW. Naming of the waves in the ECG, with a brief account of their genesis. Circulation. 1998 Nov 3;98(18):1937-42. DOI:10.1161/01.cir.98.18.1937 | PubMed ID:9799216 | HubMed [Hurst] All Medline abstracts: PubMed | HubMed ======================
Frequently Asked Questions
Disclaimers
Contact
Benefactors
How to improve this website
The ECG course
Introduction
Basics
Rhythm
Rate
Conduction (PQ,QRS,QT)
Heart axis
P wave morphology
QRS morphology
ST morphology
The ECG textbook
Normal tracing
Technical Problems
Sinus rhythms
Arrhythmias:
- supraventricular
- junctional
- ventricular
- genetic
- ectopic beats
AV Conduction
Intraventricular Conduction
Myocardial Infarction
QRS axis and voltage
Chamber Hypertrophy
Repolarization
Clinical Disorders
Electrolyte Disorders
Pacemaker
Cases and Examples
Cases and Examples
Guess the Culprit
Rhythm Puzzles
Tools
What links here
Related changes
Special pages
Printable version
Permanent link
Page information This page was last edited on 3 March 200
===========================
Introduction
Jump to navigation Jump to search
«/ Basics»
Author(s) J.S.S.G. de Jong, MD
Moderator J.S.S.G. de Jong, MD
Supervisor
some notes about authorship

A short ECG registration of normal heart rhythm (sinus rhythm)
The aim of this course is to enable the student to understand and recognize normal ECGs and interpret abnormalities. The course is divided into two different sections. First the basics will be presented. This is followed by the interpretation of the normal ECG according to the 7+2 step plan:
7+2 step plan
Step 1: Rhythm
Step 2: Rate
Step 3: Conduction (PQ,QRS,QT)
Step 4: Heart axis
Step 5: P wave morphology
Step 6: QRS morphology
Step 7: ST morphology
Step 7+1: Compare the current ECG with a previous one
Step 7+2: Conclusion
Note: It is important to realize that not all these steps may be applicable when you encounter ECG abnormalities. If, for example, the rhythm is not sinus in the first step, the algorithm to analyze arrhythmias should be followed. If a Left Bundle Branch Block is present in step 3, ST morphology will be strongly influenced by this defect.
Finally the real world is presented through practice ECGs.
After you have finished the course you are invited to come back to read more about abnormal ECGs in the ECG textbook.
ECG textbook
Normal Tracing
A Concise History of the ECG
Technical Problems
Sinus Rhythms Sinus Tachycardia
Sinus Bradycardia
Arrhythmias: Supraventricular
Junctional
Ventricular
Genetic
Ectopic Beats
AV Conduction
Intraventricular Conduction
Myocardial Infarction
Chamber Hypertrophy
Repolarization
Clinical Disorders
Electrolyte Disorders
Pacemaker
ECGs in Athletes
ECGs in Children
Accuracy of Computer Interpretation Also read our Frequently Asked Questions section.
=====
Basics
Jump to navigation Jump to search
«Introduction Step 1: Rhythm»
Author(s) I.A.C. van der Bilt, MD
Moderator I.A.C. van der Bilt, MD
Supervisor
some notes about authorship
Contents 1 How do I begin to read an ECG?
2 What does the ECG register?
3 The ECG represents the sum of the action potentials of millions of cardiomyocytes
4 The electric discharge of the heart
5 The different ECG waves
6 The history of the ECG
7 The ECG electrodes 7.1 The Extremity Leads
7.2 The Chest Leads
8 ECG variants
9 Color coding of the ECG leads
10 Special Leads
11 Ladder diagram
12 Technical Problems
13 References
How do I begin to read an ECG?
A short ECG registration of normal heart rhythm (sinus rhythm)

An example of a normal ECG. Click on the Image for an enlargement
Click on the ECG to see an enlargement. Where do you start when interpreting an ECG? On the top left are the patient's information, name, sex and date of birth
At the right of that are below each other the Frequency, the conduction times (PQ,QRS,QT/QTc), and the heart axis (P-top axis, QRS axis and T-top axis)
Farther to the right is the interpretation of the ECG written (this may be missing in a 'fresh' ECG, but later the interpretation of the cardiologist or computer will be added)
Down left is the 'paper speed' (25 mm/s on the horizontal axis), the sensitivity (10mm/mV) and the filter's frequency (40Hz, filters noise from eg. lights).
There is a calibration. At the beginning of every lead is a vertical block that shows with what amplitude a 1 mV signal is drawn. So the height and depth of these signals are a measurement for the voltage. If this is not set at 10 mm, there is something wrong with the machine setting.
Finally we have the ECG leads themselves.These will be discussed below.
Note that the layout is different for each machine, but most machines will show the information above somewhere.
What does the ECG register? The electrocardiogramAn electrocardiogram (ECG or EKG) is a register of the heart's electrical activity.
Just like skeletal muscles, heart muscles are electrically stimulated to contract. This stimulation is also called activation or excitation. Cardiac muscles are electrically charged at rest. The inside of the cell is negatively charged relative to the outside (resting potential). If the cardiac muscle cells are electrically stimulated, they depolarize (the resting potential changes from negative to positive) and contract. The electrical activity of a single cell can be registered as the action potential. As the electrical impulse spreads through the heart, the electrical field changes continually in size and direction. The ECG is a graph of these electrical cardiac signals.
The ECG represents the sum of the action potentials of millions of cardiomyocytes

Ion currents of the cardiomyocytes

The heart consists of approximately 300 billion cells

In rest the heart cells are negatively charged. Through the depolarization by surrounding cells they become positively charged and they contract.
<youtube>j9w1qylp4TY</youtube>
This movie shows the contraction of a single (rabbit) heart cell. The glass electrode measures the electrical current in the heart cell (with thepatch-clamp method). The electrical signal is written in blue and shows the action potential. Courtesy of Arie Verkerk and Antoni van Ginneken, AMC, Amsterdam, The Netherlands.
The individual action potentials of the individual cardiomyocytes are averaged. The final result, which is shown on the ECG, is actually the average of billions of microscopic electrical signals.
During the depolarization, sodium ions stream into the cell. Subsequently, the calcium ions stream into the cell. These calcium ions cause the actual muscular contraction.
Finally the potassium ions stream out of the cell. During repolarization the ion concentration returns to its precontraction state. On the ECG, an action potential wave coming toward the electrode is shown as a positive (upwards) signal. Here the ECG electrode is represented as an eye.
The electric discharge of the heart

The conduction system of the heart
The sinoatrial node (SA node) contains the fastest physiological pacemaker cells of the heart; therefore, they determine the heart rate. First the atria depolarize and contract. After that the ventricles depolarize and contract. The electrical signal between the atria and the ventricles goes from the sinus node via the atria to the AV-node (atrioventricular transition) to the His bundle and subsequently to the right and left bundle branches, which end in a dense network of Purkinje fibers. The depolarization of the heart results in an electrical force which has a direction and magnitude; an electrical vector. This vector changes every millisecond of the depolarization. In the animation vectors for atrial depolarization, ventricular depolarization and ventricular repolarization are shown.
The different ECG waves

The origin of the different waves on the ECG

The QRS complex is formed by the sum of the electric avtivity of the inner (endocardial) and the outer (epicardial) cardiomyocytes

Example of the different QRS configurations
The P wave is the result of the atrial depolarization. This depolarization starts in the SA (sinoatrial) node. The signal produced by pacemaker cells in the SA node is conducted to the right and left atria. Normal atrial repolarization is not visible on the ECG (but can be visible during atrial infarction and pericarditis).
The QRS complex is the average of the depolarization waves of the inner (endocardial) and outer (epicardial) cardiomyocytes. As the endocardial cardiomyocytes depolarize slightly earlier than the outer layers, a typical QRS pattern occurs (figure).
The T wave represents the repolarization of the ventricles. There is no cardiac muscle activity during the T wave.
One heart beat consists of an atrial depolarization --> atrial contraction --> p-wave, ventricular depolarization --> ventricular contraction --> ORS-complex and the resting phase (including the repolarization during the T-wave) between two heart beats.
Have a look at this [animation of the heart cycle]
The origin of the U wave is unknown. This wave possibly results from "afterdepolarizations" of the ventricles.
The letters "Q", "R" and "S" are used to describe the QRS complex
Q: the first negative deflection after the p-wave. If the first deflection is not negative, the Q is absent.
R: the positive deflection
S: the negative deflection after the R-wave
Small print letters (q, r, s) are used to describe deflections of small amplitude. For example: qRS = small q, tall R, deep S.
R`: is used to describe a second R-wave (as in a right bundle branch block)
See figure for some examples of this.
The history of the ECG
A concise history of the ECG is presented in a different chapter.
The ECG electrodes

The limb leads

The chest leads
Electrical activity going through the heart can be measured by external (skin)electrodes. The electrocardiogram (ECG) registers these activities from electrodes which have been attached onto different places on the body. In total, twelve leads are calculated using ten electrodes.
The ten electrodes are: The four extremity electrodes: LA - left arm
RA - right arm
N - neutral, on the right leg (= electrical earth, or point zero, to which the electrical current is measured)
F - foot, on the left leg
It makes no difference whether the electrodes are attached proximal or distal on the extremities. However, it is best to be uniform in this. (eg. do not attach an electrode on the left shoulder and one on the right wrist). The six chest electrodes: V1 - placed in the 4th intercostal space, right of the sternum
V2 - placed in the 4th intercostal space, left of the sternum
V3 - placed between V2 and V4
V4 - placed 5th intercostal space in the nipple line. Official recommendations are to place V4 under the breast in women.[1]
V5 - placed between V4 and V6
V6 - placed in the midaxillary line on the same height as V4 (horizontal line from V4, so not necessarily in the 5th intercostal space)
With the use of these 10 electrodes, 12 leads can be derived. There are 6 extremity leads and 6 precordial leads.
The Extremity Leads

The extremity leads are: I from the right to the left arm
II from the right arm to the left leg
III from the left arm to the left leg
An easy rule to remember: lead I + lead III = lead II This is done with the use of the height or depth, independent of the wave (QRS, P of T). Example: if in lead I, the QrS complex is 3 mm in height and in lead III 9mm, the height of the QRS-complex in lead II is 12mm.
Other extremity leads are: AVL points to the left arm
AVR points to the right arm
AVF points to the feet
The capital A stands for "augmented" and V for "voltage".
(aVR + aVL + aVF = 0)
The Chest Leads
The precordial, or chest leads, (V1,V2,V3,V4,V5 and V6) 'observe' the depolarization wave in the frontal plane.
Example: V1 is close to the right ventricle and the right atrium. Signals in these areas of the heart have the largest signal in this lead. V6 is the closest to the lateral wall of the left ventricle.
ECG variants
Besides the standard 12 lead ECG a couple of variants are in use: The 3 channel ECG uses 3 or 4 ECG electrodes. Red is on the right, yellow on the left arm, green on the left leg ('sun shines on the grass') and black on the right leg. These basic leads yield enough information for rhythm-monitoring. For determination of ST elevation, these basic leads are inadequate as there is no lead that gives (ST) information about the anterior wall. ST changes registered during 3-4 channel ECG monitoring should prompt acquisition of a 12 lead ECG.
The 5 channel ECG uses 4 extremitiy leads and 1 precordial lead. This improves ST segment accuracy, but is still inferior to a 12 lead ECG. [2][3]
In vector electrocardiography the movement of electrical acitivity of the P, QRS and T wave is described. Additional X,Y and Z leads are recorded. Vector electrocardiography is rarely used nowadays, but is sometimes useful in a research setting.
In body surface mapping several arrays are used to accurately map the cardiac electrical wavefront as it moves over de body surface. With this information the electrical acitivity of the heart can be calculated. This is sometimes used in a research setting.
Color coding of the ECG leads
Two systems for ECG lead color coding are used: the AHA (American Heart Association) system and the IEC (International Electrotechnical Commission) system:
AHA (American Heart Association) IEC (International Electrotechnical Commission)
Location Inscription Colour Inscription Colour
Right Arm RA White R Red
Left Arm LA Black L Yellow
Right Leg RL Green N Black
Left Leg LL Red F Green
Chest V1 Brown/Red C1 White/Red
Chest V2 Brown/Yellow C2 White/Yellow
Chest V3 Brown/Green C3 White/Green
Chest V4 Brown/Blue C4 White/Brown
Chest V5 Brown/Orange C5 White/Black
Chest V6 Brown/Purple C6 White/Violet
Special Leads

Leads V7,V8 and V9 can be helpful in the diagnosis of posterior myocardial infarction

Changed lead positions of leads V3 and V5 to increase the sensitiviy to 'catch' a Brugada pattern on the ECG.

A patient with atrial fibrillation with a 'Lewis Lead' positioning of the leads. Compared with the normal lead configuration, the atrial signal is enlarged. Although some parts have a 'sawtooth' appearance consistent with atrial flutter, the rhythm is atrial fibrillation as there is a changing pattern in the atrial activity.

The same patient with a normal lead configuration. The rhythm is atrial fibrillation. The atrial activity in lead V1 is organized probably due to a organisation of electrical activity after it enters the right atrial appendage, close to lead V1.
Throughout history extra lead positions have been tried. Most are rarely used in practice, but they can deliver very valuable diagnostic clues in specific cases. Leads to improve diagnosis in right ventricular en posterior infarction:
In case of an inferior wall infarct, extra leads may be used: 1. On a right-sided ECG, V1 and V2 remain on the same place. V3 to V6 are placed on the same place but mirrored on the chest. So V4 is in the middle of the right clavicle. The ECG should be marked as a Right-sided ECG. V4R (V4 but right sided) is a sensitive lead for diagnosing right ventricular infarctions. 2. Leads V7-V8-V9 can be used to diagnose a posterior infarct. After V6, leads are placed towards the back. See the chapter Ischemia for other ways of diagnosing posterior infarction.
Leads to improve detection of atrial rhythm: In wide complex tachycardia, good detection of atrial rhythm and atrio-ventricular dissociation can be very helpful in the diagnosis process. An esophagal ECG electrode placed close to the atria can be helpful. Another, less invasive, method is the Lewis Lead. This is recorded by changing the limb electrodes, placing the right arm electrode in the second intercostal space and the left arm electrode in the fourth intercostal space, both to the right of the sternum. Furthermore gain is increased to 20mm/mV and paper speed to 50mm/sec.[4]ß Lead positioning to enhance detection of Brugada syndrome
Ladder diagram

A ladder diagram is a diagram that shows the presumed origin of impulse formation and conduction in the heart. A = atrial, AV = AV node, V = ventricles
A ladder diagram is a diagram to explain arrhythmias. The figure shows a simple ladder diagram for normal sinus rhythm, followed by av-nodal extrasystole. The origin of impulse formation (sinus node for the first two beats and AV junction for the third beat) and the conduction in the heart are shown.
Technical Problems
Also read the chapter about Technical Problems. That will help you recognize electrical disturbances and lead reversals.
References Kligfield P, Gettes LS, Bailey JJ, Childers R, Deal BJ, Hancock EW, van Herpen G, Kors JA, Macfarlane P, Mirvis DM, Pahlm O, Rautaharju P, Wagner GS, American Heart Association Electrocardiography and Arrhythmias Committee, Council on Clinical Cardiology, American College of Cardiology Foundation, Heart Rhythm Society, Josephson M, Mason JW, Okin P, Surawicz B, and Wellens H. Recommendations for the standardization and interpretation of the electrocardiogram: part I: The electrocardiogram and its technology: a scientific statement from the American Heart Association Electrocardiography and Arrhythmias Committee, Council on Clinical Cardiology; the American College of Cardiology Foundation; and the Heart Rhythm Society: endorsed by the International Society for Computerized Electrocardiology. Circulation. 2007 Mar 13;115(10):1306-24. DOI:10.1161/CIRCULATIONAHA.106.180200 | PubMed ID:17322457 | HubMed [Kligfield]
Rodrigues de Holanda-Miranda W, Furtado FM, Luciano PM, and Pazin-Filho A. Lewis lead enhances atrial activity detection in wide QRS tachycardia. J Emerg Med. 2012 Aug;43(2):e97-9. DOI:10.1016/j.jemermed.2009.08.057 | PubMed ID:20022196 | HubMed [Lewis1]
Du Bois-Reymond, E. Untersuchungen über thierische Elektricität. Reimer, Berlin: 1848. [Dubois]
Hoffa M, Ludwig C. 1850. Einige neue versuche uber herzbewegung. Zeitschrift Rationelle Medizin, 9: 107-144 [Hoffa]
Waller AD. A demonstration on man of electromotive changes accompanying the heart's beat. J Physiol (London) 1887;8:229-234 [Waller]
Einthoven W. Le telecardiogramme. Arch Int de Physiol 1906;4:132-164 [Einthoven]
Einthoven W. Über die Form des menschlichen Electrocardiogramms. Pfügers Archiv maart 1895, pagina 101-123 [Einthoven2]
Marey EJ. Des variations electriques des muscles et du couer en particulier etudies au moyen de l'electrometre de M Lippman. Compres Rendus Hebdomadaires des Seances de l'Acadamie des sciences 1876;82:975-977 [Marey]
Márquez MF, Colín L, Guevara M, Iturralde P, and Hermosillo AG. Common electrocardiographic artifacts mimicking arrhythmias in ambulatory monitoring. Am Heart J. 2002 Aug;144(2):187-97. DOI:10.1067/mhj.2002.124047 | PubMed ID:12177632 | HubMed [Marquez]
Hurst JW. Naming of the waves in the ECG, with a brief account of their genesis. Circulation. 1998 Nov 3;98(18):1937-42. DOI:10.1161/01.cir.98.18.1937 | PubMed ID:9799216 | HubMed [Hurst] All Medline abstracts: PubMed | HubMed ======================
ليست هناك تعليقات:
إرسال تعليق